How to create a survey?
How to create a survey?
Before formulating questions, think about the structure of whole survey. Based on the topic and objectives of the survey, divide your questionnaire into several sections each concentrating on a different issue.
Survey usually starts with general questions and continues with more specific questions. In the example below see structure of the survey which investigates the problem why shopping centre Gamma is experiencing a decrease of shoppers.
Main sections of the survey
1) Information about respondents. Even in anonymous surveys it is useful to find out the gender, age and education level of the respondents. This data will give you the possibility to analyze the results in different socio-demographic profiles (women vs. men, age groups etc.)
2) General information - experience, knowledge and perceptions about shopping malls in general.
3) Specific information. Experience, knowledge and perceptions about the particular shopping mall Gamma:
4) Suggestion section or testing possible solutions of the problem.
It is recommended to include at least one open question (without predefined answer options), where respondent can write his own thoughts. These answers might give you new ideas for the possible problem solutions. Additionally, it is advised to use hierarchy and scale questions that allow more precise data analysis to evaluate attitudes (e.g. satisfaction, importance).
Survey usually starts with general questions and continues with more specific questions. In the example below see structure of the survey which investigates the problem why shopping centre Gamma is experiencing a decrease of shoppers.
Main sections of the survey
1) Information about respondents. Even in anonymous surveys it is useful to find out the gender, age and education level of the respondents. This data will give you the possibility to analyze the results in different socio-demographic profiles (women vs. men, age groups etc.)
2) General information - experience, knowledge and perceptions about shopping malls in general.
- Which shopping centres are visited most frequently?
- What are factors influencing the choice of shopping malls (convenient access, number of shops, regular promotions, etc)?
- Reasons for visiting shopping centres (grocery shopping, visiting restaurants, buying gifts, etc)?
- Satisfaction with shopping malls.
3) Specific information. Experience, knowledge and perceptions about the particular shopping mall Gamma:
- When was the last time the respondent visited shopping mall Gamma?
- Evaluate factors for Gamma and the 3 main competitors (convenient access, number of shops, regular promotions, etc)?
- What are the reasons for visiting shopping mall Gamma (grocery shopping, visiting restaurants, buying gifts, etc)?
- Loyalty and satisfaction with Gamma?
4) Suggestion section or testing possible solutions of the problem.
- Would marketing activities and promotions increase the number of visitors?
- Would a better shop selection attract more visitors (which shops)?
- Would the improvement in public transport access near Gamma improve the consumer flow?
- Other suggestions.
It is recommended to include at least one open question (without predefined answer options), where respondent can write his own thoughts. These answers might give you new ideas for the possible problem solutions. Additionally, it is advised to use hierarchy and scale questions that allow more precise data analysis to evaluate attitudes (e.g. satisfaction, importance).
Before creating a survey
1) Gather information. Study available materials about your topic, look for similar researches. Think of the main causes of the problem and try to analyze potential solutions. Based on the analysis and research done prior the questionnaire, it will be easier to formulate your survey questions and answer options. Defining survey objective, main questions and hypothesis are the basis for a successful survey.
2) Define the objective - for example, why the visitor flow of shopping mall Gamma has decreased.
3) Define main survey questions. For example:
4) Define hypothesis. For example:
5) Choose the required number of respondents for your survey.
6) Imagine how the results might look like. What socio-demographic data (age, gender, education level, and income level) might be required for the analysis? If you want to carry out statistical analysis (e.g. correlation analysis or significance testing), use similar evaluation scales and parameters.
2) Define the objective - for example, why the visitor flow of shopping mall Gamma has decreased.
3) Define main survey questions. For example:
- Find out how often and which shopping centres consumers are visiting.
- Evaluate shopping mall Gamma by the certain criteria that are important for customers deciding which shopping centre to visit.
- Find out customer opinion how to improve the flow of visitors.
4) Define hypothesis. For example:
- Most of the visitors believe that shopping centre Gamma does not have an easy access;
- Most of the visitors are not satisfied with the selection of shops at Gamma.
5) Choose the required number of respondents for your survey.
6) Imagine how the results might look like. What socio-demographic data (age, gender, education level, and income level) might be required for the analysis? If you want to carry out statistical analysis (e.g. correlation analysis or significance testing), use similar evaluation scales and parameters.
Creating a survey
1) Keep it simple and short. Create easy understandable questions. Do not complicate. Avoid using too many words in one sentence (better to use two short sentences than one long).
2) Avoid putting too many questions on one page. For example, it’s better to split one long matrix type question into two parts – using two separate questions. Always think of how to keep the attention of respondents throughout the whole questionnaire (it gives more precise answers and influences the reliability of your survey results).
3) Use filter or transition answers. (For example, if the respondent does not watch TV, the next question about favourite TV channels is not relevant.) Respondent might loose the interest to read irrelevant questions and the results will be untrustworthy.
4) Make sure you have included all possible answer options to your question. For example, in the question about favourite coffee brands add answer option “I do not drink coffee”. If you are not certain that all possible answer options are included – add answer option “other” where respondent can enter his own answer.
5) Create precise questions.
Examples:
6) Be careful with questions about frequency or amount.
Avoid using misleading words, e.g. regularly, often, sometimes, on average. Respondents can interpret these measures differently – “regularly” for some respondents can mean - once per month, for others - once per week etc. When formulating question, give precise time period or explain the meaning of each measure.
7) Try to avoid answer options “difficult to answer” or “hard to tell”. Such options should be used only if you know the respondent really might lack the information to answer.
8) Using similar words with opposite meaning in one question might confuse respondent and create misreading errors. It is advisable to use “aware/uninformed” rather than “aware/unaware”.
9) Sensitive and personal questions. Not always respondents are willing to disclose personal information, like income level. It is advisable to ask approximate range instead of precise information in such questions. For example, in the question about income level, do not ask precise amount, but create several answer options with income level ranges (from-to).
10) Provide option to skip or not to answer the question. If a question is too sensitive, respondents might quit the survey. It is better not to have an answer for this particular question and not to loose the respondent for the following questions.
11) Avoid suggestive and leading questions, like: “Which car brand do you prefer – the exclusive Lexus or Toyota?”
12) Maintain interest of respondents for the whole survey. Do not create too long surveys. Reconsider each question if you really need it. It is important to create good impression at the beginning of the survey by having interesting questions. It is advisable not to include open type questions at the beginning of the survey (the best place for these questions is in the middle of the survey)
13) Once all questions have been created, review and test the survey. Check for spelling mistakes.
2) Avoid putting too many questions on one page. For example, it’s better to split one long matrix type question into two parts – using two separate questions. Always think of how to keep the attention of respondents throughout the whole questionnaire (it gives more precise answers and influences the reliability of your survey results).
3) Use filter or transition answers. (For example, if the respondent does not watch TV, the next question about favourite TV channels is not relevant.) Respondent might loose the interest to read irrelevant questions and the results will be untrustworthy.
4) Make sure you have included all possible answer options to your question. For example, in the question about favourite coffee brands add answer option “I do not drink coffee”. If you are not certain that all possible answer options are included – add answer option “other” where respondent can enter his own answer.
5) Create precise questions.
Examples:
- How many children are in your family? (The meaning of “children” should be clarified in more detail, otherwise respondent might count in also the 25 year son who lives separately and has his own family.)
- More precise question would be: How many children aged 18 years and younger live in your household?
- What is your income level? (Respondent will not understand if he is asked to indicate income before / after taxes; yearly or monthly salary.)
- More precise question: What is your average income level per month during last six months (including bonuses, after salary taxes)?
6) Be careful with questions about frequency or amount.
Avoid using misleading words, e.g. regularly, often, sometimes, on average. Respondents can interpret these measures differently – “regularly” for some respondents can mean - once per month, for others - once per week etc. When formulating question, give precise time period or explain the meaning of each measure.
7) Try to avoid answer options “difficult to answer” or “hard to tell”. Such options should be used only if you know the respondent really might lack the information to answer.
- Example when the option “difficult to evaluate” should be used. In an employee evaluation surveys, when one has to evaluate the less familiar colleague (i.e., from other department).
- Example when the option “difficult to evaluate” should not be used - question asking for opinion about school uniforms. Everybody is able to formulate own opinion on this question. Answer option “difficult t to evaluate” would be an easy choice for respondents that have not thought about this question before. If this answer option is not available, respondent will formulate his opinion and you will receive more precise data on this question.
8) Using similar words with opposite meaning in one question might confuse respondent and create misreading errors. It is advisable to use “aware/uninformed” rather than “aware/unaware”.
9) Sensitive and personal questions. Not always respondents are willing to disclose personal information, like income level. It is advisable to ask approximate range instead of precise information in such questions. For example, in the question about income level, do not ask precise amount, but create several answer options with income level ranges (from-to).
10) Provide option to skip or not to answer the question. If a question is too sensitive, respondents might quit the survey. It is better not to have an answer for this particular question and not to loose the respondent for the following questions.
11) Avoid suggestive and leading questions, like: “Which car brand do you prefer – the exclusive Lexus or Toyota?”
12) Maintain interest of respondents for the whole survey. Do not create too long surveys. Reconsider each question if you really need it. It is important to create good impression at the beginning of the survey by having interesting questions. It is advisable not to include open type questions at the beginning of the survey (the best place for these questions is in the middle of the survey)
13) Once all questions have been created, review and test the survey. Check for spelling mistakes.
Analysis of the results
1) Delete superficial answers. Test attention of respondents by creating two similar questions, one at the beginning, the other - at the end of the survey. Delete respondents that have opposite answers in these questions.
2) Be careful with charting multiple choice questions. Which will be more informative – to chart the split of answers based on the number of respondents or the number of answers? If you base it on the number of respondents - it is suggested to use bar charts instead of pie charts (as the sum of all percentages will be more than 100%).
3) How to choose the right chart type when presenting results? There are not correct or incorrect ways how to display the results. The best way of choosing the chart type is to look at the context of the question and the particular information you want to highlight. Experiment with different chart types to find the best option for you. MySurvs.com offers to view the answers of each question using four most frequently used chart types – pie chart, bar charts (horizontal and vertical) and line diagrams. Below are some examples how to choose the appropriate chart type.
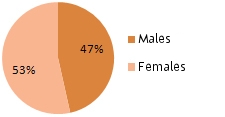
Pie charts are useful when you want to emphasize particular answer option in relation to overall situation. This chart shows the proportion of each answer taking into account the context of total amount (e.g. market shares; ethnic groups in a country).
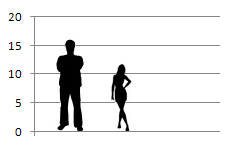
Example: the number of male and female respondents. This chart shows that both genders have similar representation.
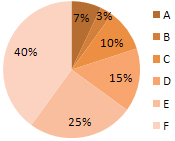
Example: market shares of companies. The chart shows the share of each company in particular industry.
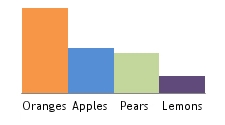
Bar chart is used to compare answers with each other. In this case overall context is not so important.
Example: Which is your favourite fruit? In the bar chart it is more noticeable that apples are more popular than pears. In pie chart both answers option would appear equal.
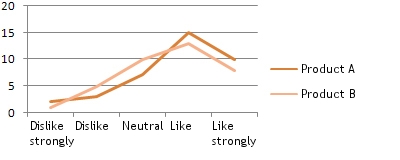
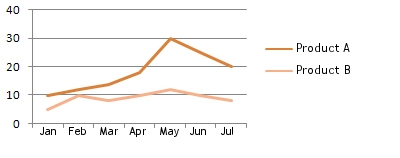
Line charts are better for presenting trends (e.g. development of trends over time).
Example: compare two products that are evaluated on the same scale. Answer options “like” and “like strongly” are most frequented for both products. Therefore based on the number of answers only, both products are equally perceived. However when displaying the results in line chart, it is more clear that product A is perceived better than product B.
Example: the analysis of monthly sales results for two products. The below chart shows that sales volume for product A is much higher than for product B. Additionally it is evident that product A has a seasonality trend – rapid sales growth in May. The sales results for product B, on the other hand, are similar during all months.
Interactive and interesting display of data Evaluate the possibility to use interactive charts depending on the occasion and audience. For example, you can show differences between answers of males and females in more interesting way.
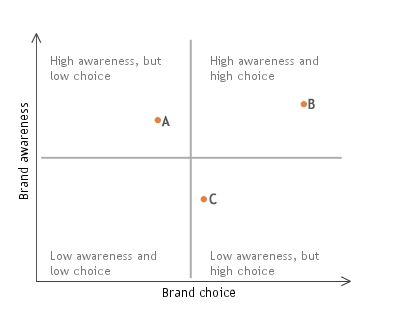
4) Create brand maps. Useful when comparing several brands according to two criteria: e.g. brand awareness and brand choice. Brand maps are helpful when analyzing strengths and weaknesses of the brands, closest competitors in the market. In the graph below brand B has high brand awareness and high brand choice. Brand C has good brand awareness, but low brand choice. Brand A has good potential to grow in the market as it has high brand choice, but low brand awareness.
5) Be careful with data interpretation. How can you state if 50% is good or bad indicator? During the interpretation of data it is advisable to compare results with other similar researches. (Compare to a research done last year, compare the results of one brand to another).
6) During the interpretation of data it is important to remember that conclusions should not be based on the results of the survey solely. In addition to the survey, other data sources should be used if possible. For example, when evaluating the results of marketing campaign, it is important not only to measure how audience liked the campaign materials, but also:
2) Be careful with charting multiple choice questions. Which will be more informative – to chart the split of answers based on the number of respondents or the number of answers? If you base it on the number of respondents - it is suggested to use bar charts instead of pie charts (as the sum of all percentages will be more than 100%).
3) How to choose the right chart type when presenting results? There are not correct or incorrect ways how to display the results. The best way of choosing the chart type is to look at the context of the question and the particular information you want to highlight. Experiment with different chart types to find the best option for you. MySurvs.com offers to view the answers of each question using four most frequently used chart types – pie chart, bar charts (horizontal and vertical) and line diagrams. Below are some examples how to choose the appropriate chart type.
Pie charts are useful when you want to emphasize particular answer option in relation to overall situation. This chart shows the proportion of each answer taking into account the context of total amount (e.g. market shares; ethnic groups in a country).
Example: the number of male and female respondents. This chart shows that both genders have similar representation.
Example: market shares of companies. The chart shows the share of each company in particular industry.
Bar chart is used to compare answers with each other. In this case overall context is not so important.
Example: Which is your favourite fruit? In the bar chart it is more noticeable that apples are more popular than pears. In pie chart both answers option would appear equal.
Line charts are better for presenting trends (e.g. development of trends over time).
Example: compare two products that are evaluated on the same scale. Answer options “like” and “like strongly” are most frequented for both products. Therefore based on the number of answers only, both products are equally perceived. However when displaying the results in line chart, it is more clear that product A is perceived better than product B.
Example: the analysis of monthly sales results for two products. The below chart shows that sales volume for product A is much higher than for product B. Additionally it is evident that product A has a seasonality trend – rapid sales growth in May. The sales results for product B, on the other hand, are similar during all months.
Interactive and interesting display of data Evaluate the possibility to use interactive charts depending on the occasion and audience. For example, you can show differences between answers of males and females in more interesting way.
4) Create brand maps. Useful when comparing several brands according to two criteria: e.g. brand awareness and brand choice. Brand maps are helpful when analyzing strengths and weaknesses of the brands, closest competitors in the market. In the graph below brand B has high brand awareness and high brand choice. Brand C has good brand awareness, but low brand choice. Brand A has good potential to grow in the market as it has high brand choice, but low brand awareness.
5) Be careful with data interpretation. How can you state if 50% is good or bad indicator? During the interpretation of data it is advisable to compare results with other similar researches. (Compare to a research done last year, compare the results of one brand to another).
6) During the interpretation of data it is important to remember that conclusions should not be based on the results of the survey solely. In addition to the survey, other data sources should be used if possible. For example, when evaluating the results of marketing campaign, it is important not only to measure how audience liked the campaign materials, but also:
- How much of the target audience have been reached by this campaign, how many have seen these ads?
- What are the changes in sales results?
- How the market shares have changed?
- What is the return on investment?